Чтобы дорисовать недорисованные траекторию нужно увеличить делитель
Недорисованные на 15мин
Будет иованно на 1часе
И так далее
Но через формулу расчета RSI
Она ближе всего к 1 при расчеделителя 2
AD |
You are here » AD » WOW.that's literally me » #8 investing.com
Чтобы дорисовать недорисованные траекторию нужно увеличить делитель
Недорисованные на 15мин
Будет иованно на 1часе
И так далее
Но через формулу расчета RSI
Она ближе всего к 1 при расчеделителя 2

Вселенная и все остальное Внутри него
построены на простых формулах
Взаимосвязанность по фрактальности.
Элементы, управляемые одной и той же формулой, способны взаимодействовать друг с другом.
-------------------------------------------
Понимая, что мир построен из туннелей «Грааль»,
---------------------
где край одного служит центром для другого туннеля (показатель) и так далее. Таким образом, мы достигаем самой сути формулы и границ свечей
— или сама Вселенная.
Так рождаются энергетические уровни. (шкалы)
Все, что от вас требуется, это выложить коды для этих взаимодействий, используя
Индикатор NINJA
и
RSI БЭНД
В качестве примеров.
Без этого не будет никаких дальнейших великих открытий.
Модель всегда одна и та же; меняется только формула взаимодействия разделителя.
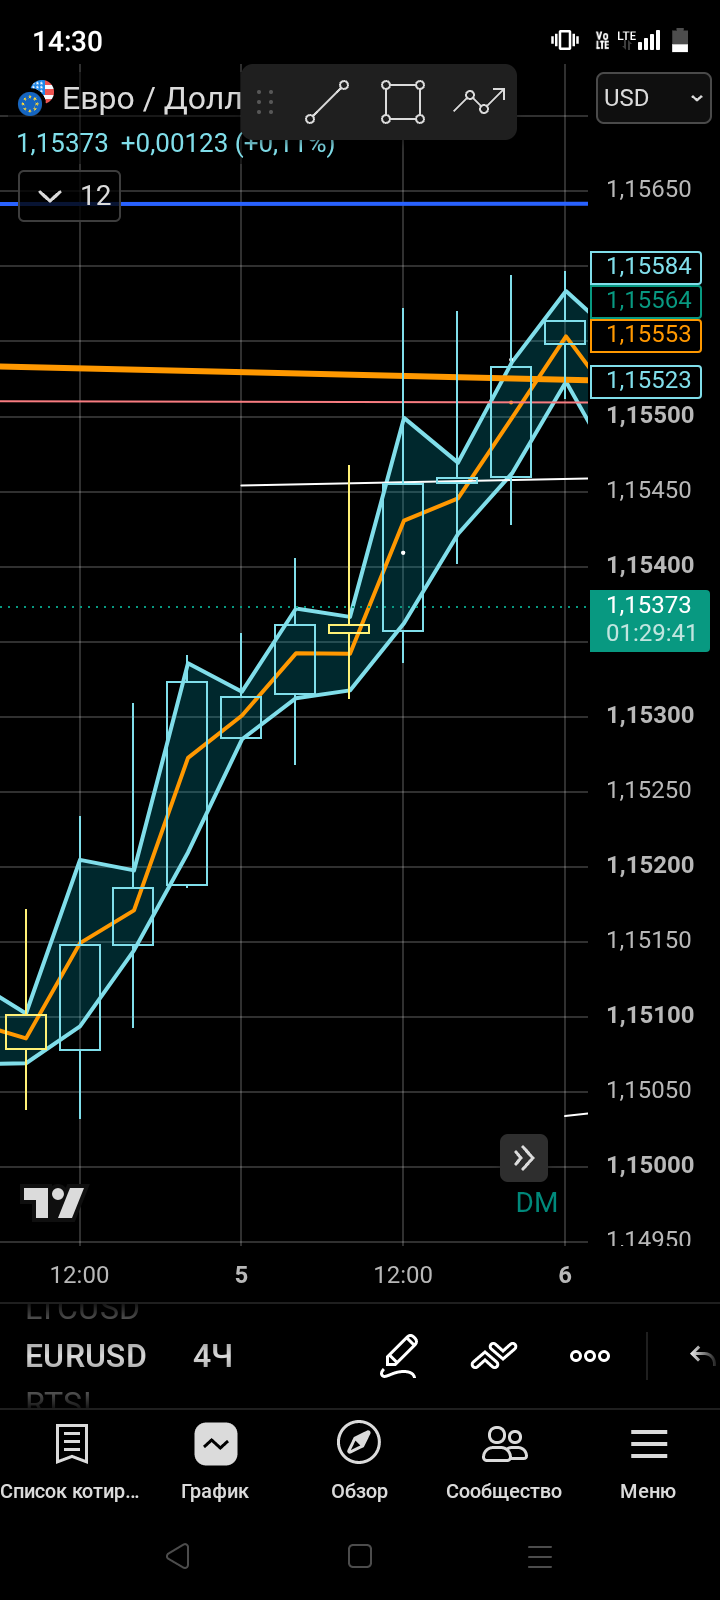
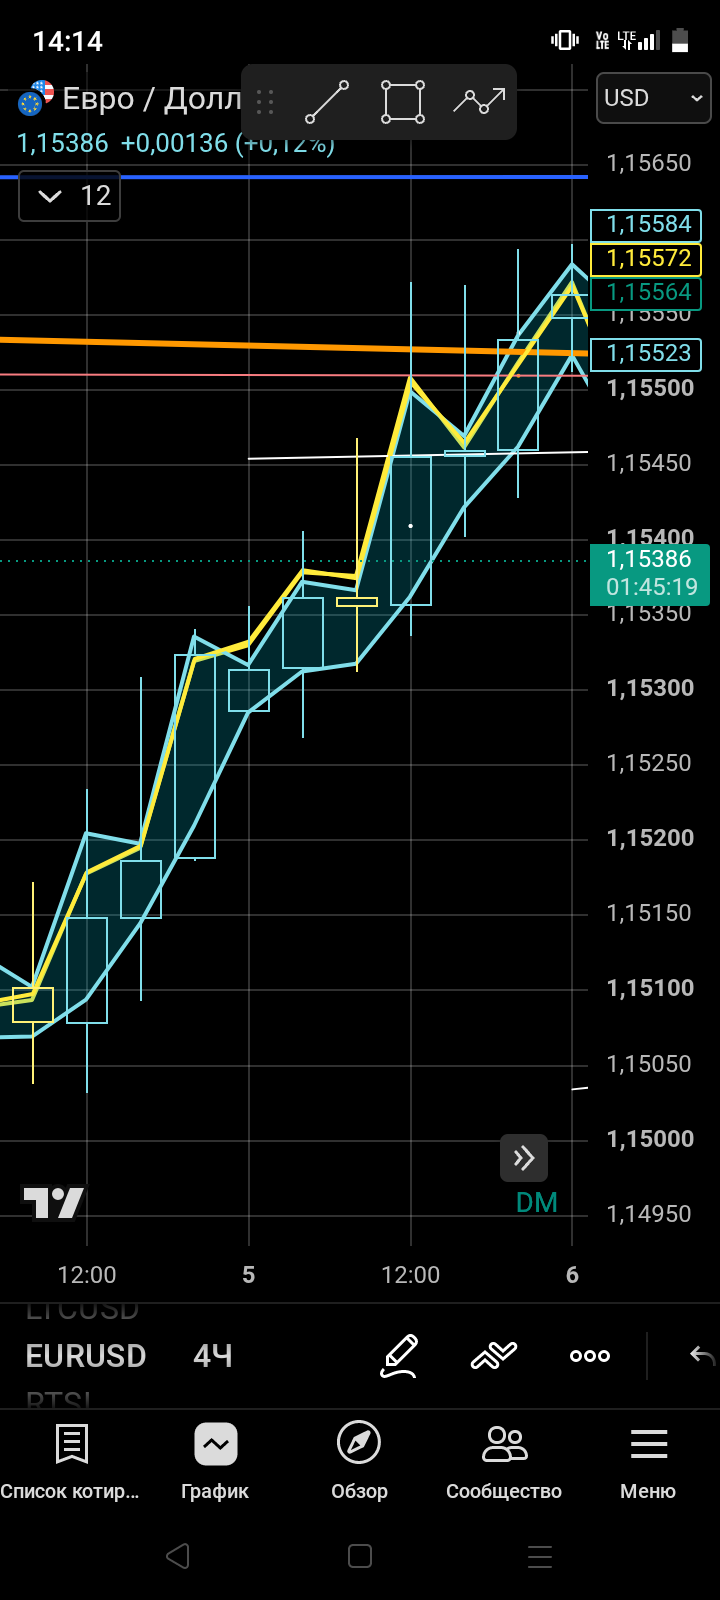
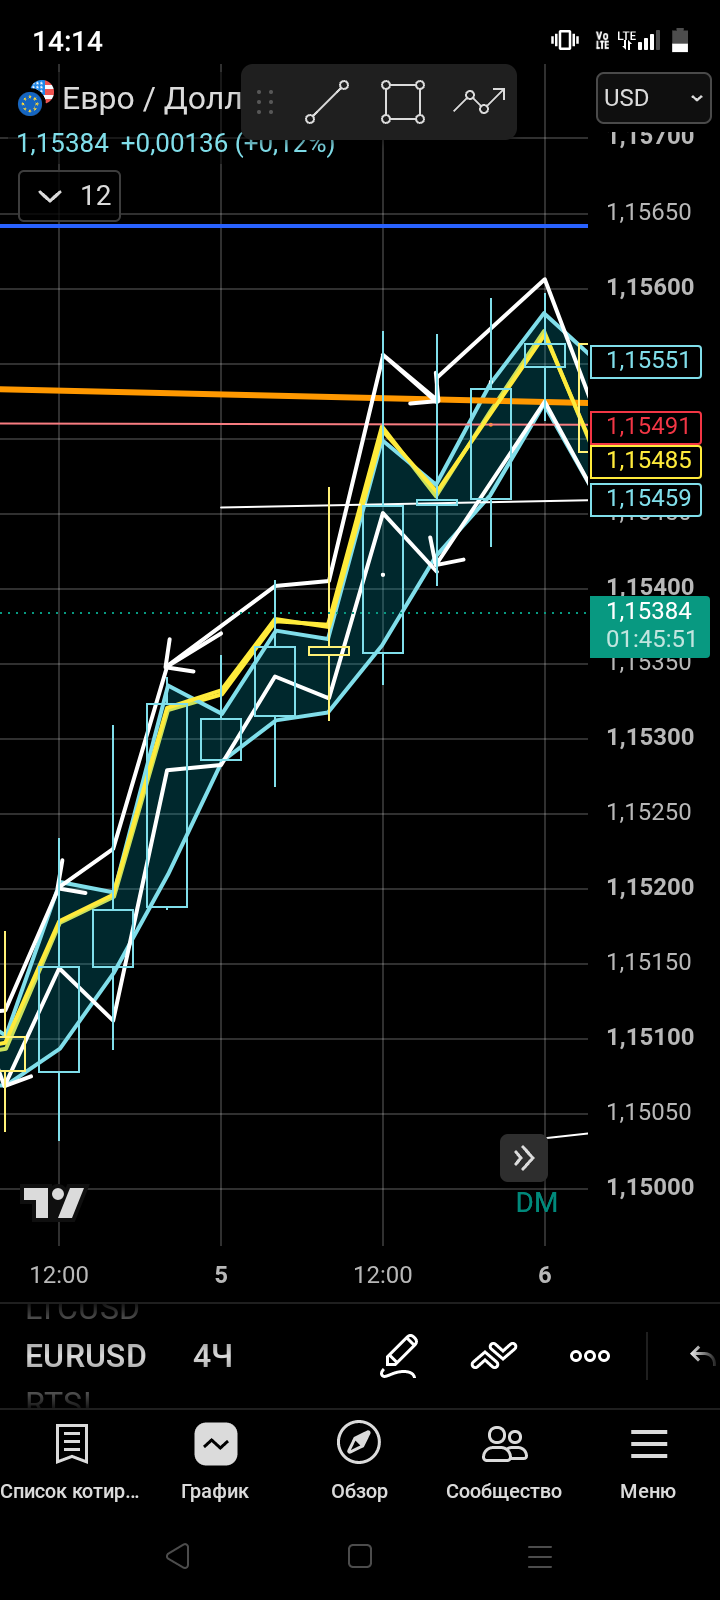
Last edited by JEDY (2026-08-13 15:18:35)
Talk about the ABSOLUTE GRAIL
It is constructed from
EMA 1 high
EMA 1 low
also equal to the GRAIL_CALIBER indicator (period 1, divisor 0.5)
Let's try to replicate it using the RSI_BAND_MTf
indicator and its iodifications.
I'm using the RSI 5 (high+low)
settings.
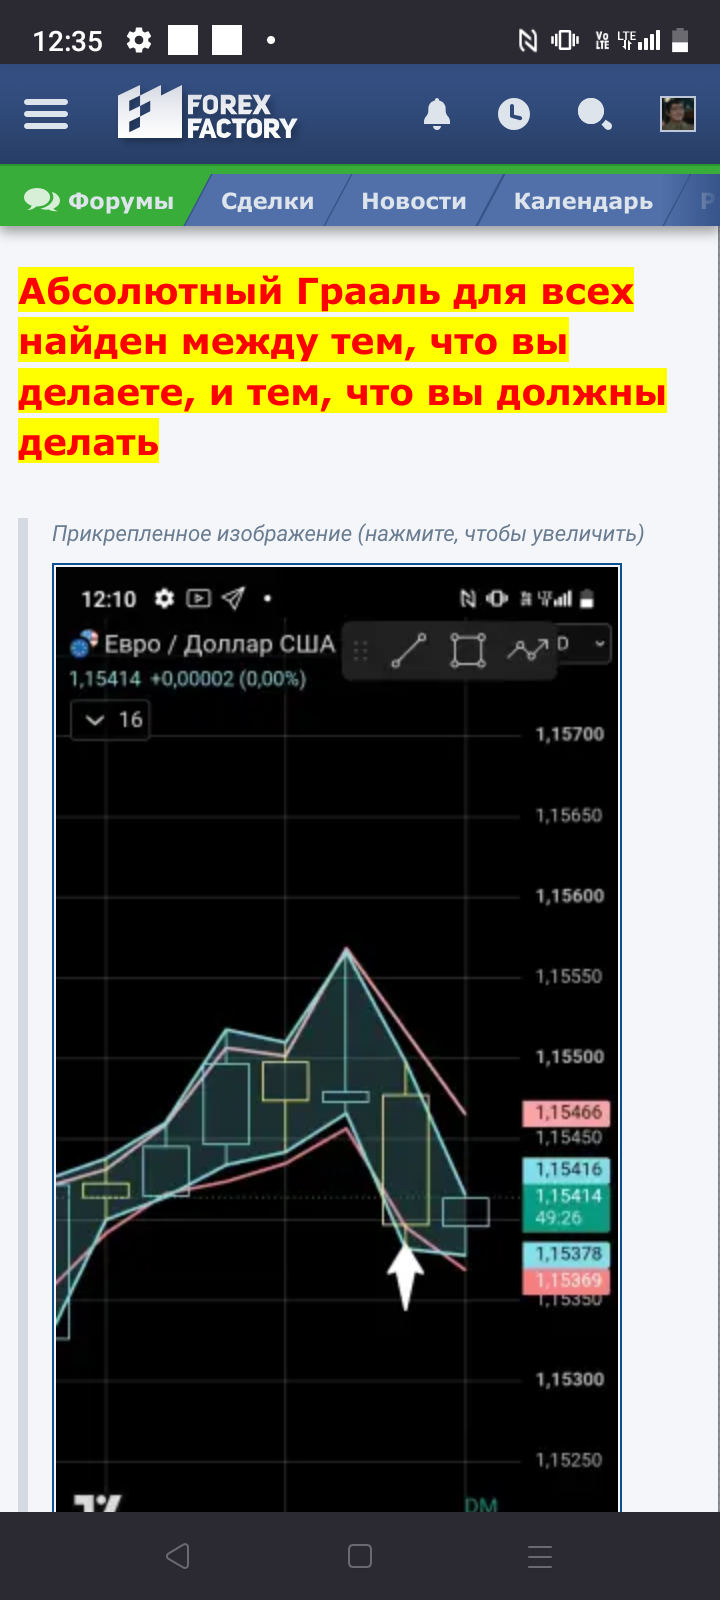
We're making one Grail channel (high)
We're making a second Grail channel (low)
Then we leave the extreme values from the two channels on the chart. They don't repaint. Although they have a slight gap. It turned out quite accurate on one side, much
Last edited by JEDY (2026-09-14 23:42:34)
The Grail can be applied anywhere.
Its meaning is as simple As if you were doing just ONE squat an hour BUT every hour Periodicity is more important
Like trading Like a bowl of soup...
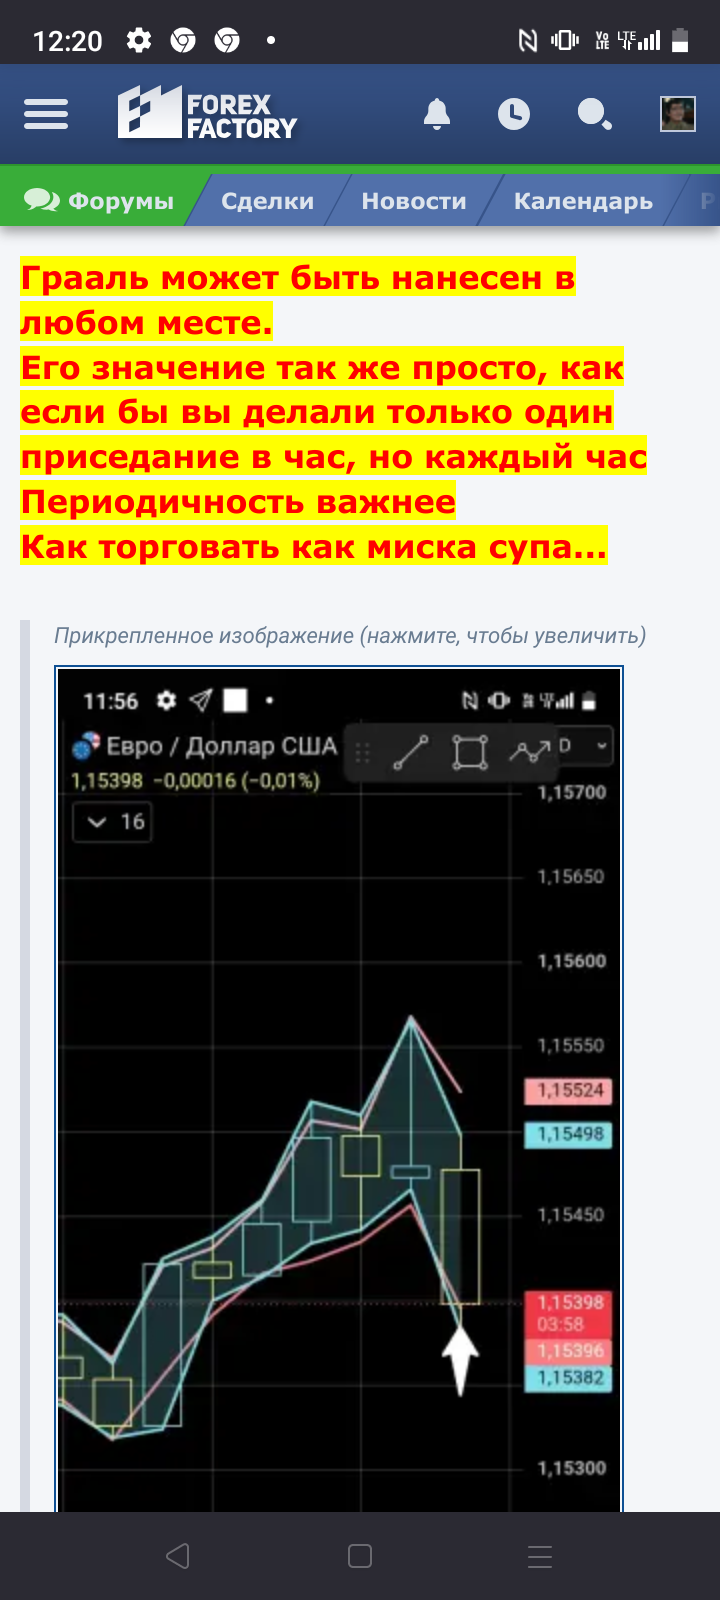
https://www.forexfactory.com/thread/pos … st15904510

Last edited by JEDY (2026-09-16 12:36:28)
https://www.tradingview.com/script/Cse5 … d-Channel/
LinRegTS
https://www.tradingview.com/script/Cse5 … d-Channel/
Last edited by JEDY (2026-11-10 01:17:14)
// This Pine Script™ code is subject to the terms of the Mozilla Public License 2.0 at https://mozilla.org/MPL/2.0/
// © jeetbeez
// _____ __ __
// /\___ \ /\ \__/\ \
// \/__/\ \ __ __\ \ ,_\ \ \____ __ __ ____
// _\ \ \ /'__`\ /'__`\ \ \/\ \ '__`\ /'__`\ /'__`\/\_ ,`\
// /\ \_\ \/\ __//\ __/\ \ \_\ \ \L\ \/\ __//\ __/\/_/ /_
// \ \____/\ \____\ \____\\ \__\\ \_,__/\ \____\ \____\ /\____\
// \/___/ \/____/\/____/ \/__/ \/___/ \/____/\/____/ \/____/
//@version=5
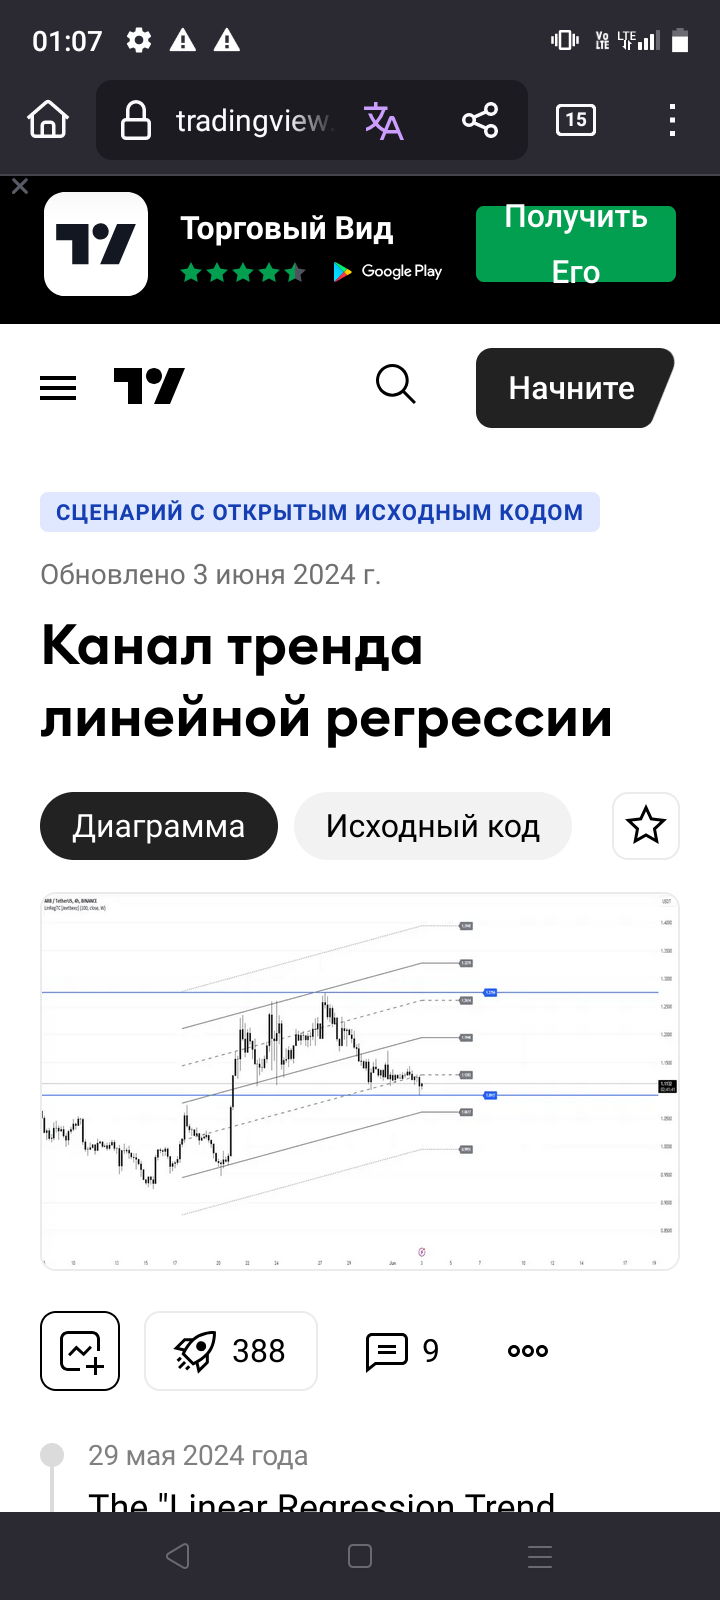
indicator("Linear Regression Trend Channel", shorttitle="LinRegTC [Jeetbeez]", overlay=true)
// Parameters
linRegPeriod = input.int(100, 'Linear Regression Length', minval=1)
linRegSource = input.source(close, 'Linear Regression Source')
tf = input.timeframe(title="Timeframe for High/Low", defval="W", options=["D", "W", "M", "3M", "6M", "12M"])
lineColor = input.color(color.gray, 'Linear Regression Color')
labelPriceColor = input.color(color.gray, 'Label Price Color')
HLcolor = input.color(color.blue, title="High/Low Color")
showHorizontal = input.bool(true, 'Show Horizontal Line')
showHL = input.bool(false, title="Show High/Low")
showPrice = input.bool(true, 'Show Price')
// High and Low calculations
High = request.security(syminfo.tickerid, tf, high)
Low = request.security(syminfo.tickerid, tf, low)
// Functions
calcSlopeIntercept(src, len) =>
max_bars_back(src, 5000)
Periods = 0.0
Values = 0.0
PeriodsSquared = 0.0
ValuesPeriods = 0.0
for i = 0 to len - 1
val = src[i]
period = i + 1.0
Periods += period
Values += val
PeriodsSquared += period * period
ValuesPeriods += val * period
slope = (len * ValuesPeriods - Periods * Values) / (len * PeriodsSquared - Periods * Periods)
intercept = Values / len - slope * Periods / len + slope
[slope, intercept]
calcDeviation(src, len, slope, intercept) =>
dev = 0.0
periods = len - 1
currentValue = intercept
for i = 0 to periods
price = src[i]
price -= currentValue
dev += price * price
currentValue += slope
math.sqrt(dev / periods)
crossingLevel(current, level) =>
(level > current and level < current[1]) or (level < current and level > current[1])
drawHorizontal(price, lineColor, lineStyle) =>
if showHorizontal
line_style = line.style_solid
if lineStyle == 'Dotted'
line_style := line.style_dotted
else if lineStyle == 'Dashed'
line_style := line.style_dashed
line.new(bar_index, price, bar_index + 15, price, xloc.bar_index, extend.none, lineColor, line_style, 2)
if showPrice
label.new(bar_index + 15, price, str.tostring(price, format.mintick), color=labelPriceColor, textcolor=color.white, size=size.small, style=label.style_label_left, textalign=text.align_right)
drawLinearRegressionLine(startIdx, startPrice, endIdx, endPrice, lineColor, lineStyle) =>
line_style = line.style_solid
if lineStyle == 'Dotted'
line_style := line.style_dotted
else if lineStyle == 'Dashed'
line_style := line.style_dashed
line.new(startIdx, startPrice, endIdx, endPrice, xloc.bar_index, extend.none, lineColor, line_style, 2)
if showPrice and not showHorizontal
label.new(endIdx, endPrice, str.tostring(endPrice, format.mintick), color=labelPriceColor, textcolor=color.white, size=size.small, style=label.style_label_left, textalign=text.align_right)
deleteAllLinesAndLabels() =>
for lineId in line.all
line.delete(lineId)
for labelId in label.all
label.delete(labelId)
processLinRegLevel(level, color, style, startPrice, endPrice, stdDev) =>
drawLinearRegressionLine(bar_index - linRegPeriod + 1, startPrice + level * stdDev, bar_index, endPrice + level * stdDev, color, style)
drawLinearRegressionLine(bar_index - linRegPeriod + 1, startPrice - level * stdDev, bar_index, endPrice - level * stdDev, color, style)
drawHorizontal(endPrice + level * stdDev, color, style)
drawHorizontal(endPrice - level * stdDev, color, style)
if crossingLevel(close, endPrice + level * stdDev)
alert('LRTC: ' + syminfo.ticker + ' crossing upper deviation line ' + str.tostring(level) + ' : ' + str.tostring(endPrice + level * stdDev, format.mintick))
if crossingLevel(close, endPrice - level * stdDev)
alert('LRTC: ' + syminfo.ticker + ' crossing lower deviation line ' + str.tostring(level) + ' : ' + str.tostring(endPrice - level * stdDev, format.mintick))
// Main Calculation
[slope, intercept] = calcSlopeIntercept(linRegSource, linRegPeriod)
stdDev = calcDeviation(linRegSource, linRegPeriod, slope, intercept)
startPrice = intercept + slope * (linRegPeriod - 1)
endPrice = intercept
// Draw Lines and Labels
deleteAllLinesAndLabels()
drawLinearRegressionLine(bar_index - linRegPeriod + 1, startPrice, bar_index, endPrice, lineColor, 'Solid')
if not showHorizontal and showPrice
label.new(bar_index, endPrice, str.tostring(endPrice, format.mintick), color=labelPriceColor, textcolor=color.white, size=size.small, style=label.style_label_left, textalign=text.align_right)
drawHorizontal(endPrice, lineColor, 'Solid')
if crossingLevel(close, endPrice)
alert('LRTC: ' + syminfo.ticker + ' crossing base line : ' + str.tostring(endPrice, format.mintick))
processLinRegLevel(1, lineColor, 'Dashed', startPrice, endPrice, stdDev)
processLinRegLevel(2, lineColor, 'Solid', startPrice, endPrice, stdDev)
processLinRegLevel(3, lineColor, 'Dotted', startPrice, endPrice, stdDev)
// High/Low Lines and Labels
var line hLine = na
var line lLine = na
var label hLabel = na
var label lLabel = na
if showHL and barstate.islast
if not na(hLine)
line.delete(hLine)
if not na(hLabel)
label.delete(hLabel)
if not na(lLine)
line.delete(lLine)
if not na(lLabel)
label.delete(lLabel)
hLine := line.new(x1=bar_index - 100, y1=High, x2=bar_index + 25, y2=High, color=HLcolor, width=2, style=line.style_solid, extend=extend.both)
if showPrice
hLabel := label.new(x=bar_index + 25, y=High, text=str.tostring(High, format.mintick), style=label.style_label_left, color=HLcolor, textcolor=color.white, size=size.small)
lLine := line.new(x1=bar_index - 100, y1=Low, x2=bar_index + 25, y2=Low, color=HLcolor, width=2, style=line.style_solid, extend=extend.both)
if showPrice
lLabel := label.new(x=bar_index + 25, y=Low, text=str.tostring(Low, format.mintick), style=label.style_label_left, color=HLcolor, textcolor=color.white, size=size.small)
You are here » AD » WOW.that's literally me » #8 investing.com